Bridge Structural Health Monitoring
A Key to Structural Performance Evaluation and Infrastructure Asset Management
M N Ramesh, Principal Consultant, Remedial Engineering Enstrectura Consultants, Bangalore
Abstract
The failure of structures during their construction and service life has seen an upward trend in the recent days. Challenging designs, demanding timeframes and unmanageable hugeness of projects are said to be primary causes of the often premature structural failures. Many a time, the construction stage monitoring had revealed that the behaviour of the structural members during their construction and /or erection was far different to what had been envisaged by the designer. The causes for these variations are many - some are technical and others are commercial.
On the other hand, the performance of the structures during their service life, from the day of their commissioning, reduces with time, at whatever rate it could be. Time dependent factors, like creep, material deterioration due to atmospheric exposure conditions, cyclic loading, fatigue etc. exacerbate the situation. Corrosion of reinforcing steel in concrete reduces the load carrying capacity of the structures. The combined effect of the above factors poses higher risk to the public and necessitated a thorough assessment of structures continuously. This can be achieved by using the Structural Health Monitoring System (SHM) that would enable diagnostic and prognostic assessment of the structures either discretely or on real time basis. SHM is about assessing the performance of structures either during its construction or during its service life, using a variety of measurement techniques leading to "smart" structures. It is also a process of implementing damage control strategy for engineering infrastructures.
What is structural health monitoring (SHM)?
The Structural Health Monitoring can be defined in different ways. SHM is about assessing the performance of structures either during its construction or during its service life, using a variety of measurement techniques leading to "smart" structures. It is also a process of implementing damage control strategy for engineering infrastructures.
Key benefits of SHM for bridges
The key benefits of Bridge Monitoring Solution for operators, constructors and designers are:
-
Avoidance of hazardous situations and even life saving, by controlling access to the asset under hazardous conditions.
-
Elimination of major breakdowns through advance monitoring systems, warning harsh environmental conditions and/ or onset of structural problems.
-
Repair cost savings through elimination of unexpected failures.
-
Maintenance cost savings through extended life of expensive components.
-
Personnel cost savings and motivation improvements through reduction of unnecessary inspection and maintenance work and consolidation of monitoring to a central location
-
Status elevation of the asset/site/project, through presentations of real-time environmental conditions, traffic and structural information to decision makers and general public.
When to monitor the structures?
Monitoring of the structures can be done at every stage from construction to service life to service life enhancement.
1. Construction stage monitoring-helps to ensure structural behavior of the members, during construction. To quote a few examples - monitoring of settlement, verticality of members, stress levels during launching and erection, cantilever deflections, mid-span deflections, stresses on the stay cables in form traveler operation etc.
2. Commissioning stage monitoring-involves, monitoring during static/dynamic load tests, to ensure the performance of the structure prior to putting the structure on service.
3. In-service monitoring-is a long term monitoring either on a periodical basis or on a continuous basis. This helps to monitor the long term behavior of the structures under service loads/ conditions. This includes, creep, fatigue, corrosion etc.
4. Maintenance stage Monitoring-Generally this is to monitor the behavior of the structure during shut down for maintenance. For example, behavior of the bridge girders when they are lifted for changing defunct or defective bridge bearings, uneven loading of spans during maintenance etc.
5. Pre and post restoration measurements or monitoring-helps to ensure that the structure has been rendered to normalcy after an intervention is affected.
6. Monitoring the structural effect-of partial demolition of a structure on the residual portion or comparing the structural behavior before and after the demolition /de-construction is done.
SHM Technology
Multidisciplinary system
SHM technology has been extensively used in aeronautical and aerospace engineering since long time. However, its application in civil engineering is a reasonably recent development. SHM is a multidisciplinary system, as it employs the knowledge of various branches of engineering and technology such as sensing technology, power electronics, communication engineering, signal processing and structural engineering. The understanding of inter and intra disciplines are very important for the successful implementation of SHM to get optimum results. This complexity calls for trained and experienced personnel in SHM activities. The various technologies employed in SHM are illustrated in the following chart.
Principle sections of SHM
Fig 1. SHM system - Simultaneous deployment of various disciplines
Regardless of their extent, all SHM systems can be designed based on a common array that will consist of the following major section to organize the activities:
-
Sensing modules placed on the structure - These modules consist of various types of sensors depending on the nature of the structure. This also includes a signal collection, conditioning and digitization unit.
-
Portable and/or fixed data acquisition systems - These modules execute pre-processing and local buffering for sensors distributed in a limited geographical area.
-
Data communication system for the transfer of the collected data to a remote computer.
-
Data Processing and Control System with database application - These modules collect, store and process the sensor data in real time, in order to provide an evaluation of the condition of the structure.
-
User Interface
-
Maintenance tools
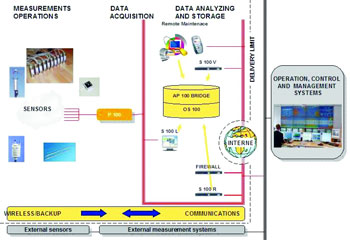
Fig 2 gives a simplified illustration of the concept.
 |
|
Fig 2.Typical layout of SHM system
|
Sensory systems
The sensory system will include the sensors and their corresponding interfacing units for input signals gathered from various monitoring equipments and sensors such as anemometers, temperature sensors, dynamic weigh-in-motion sensors, corrosion cells, hygrometers, barometers, rainfall gauges, digital video cameras, weldable strain gauges, displacement transducers, global positioning systems, fixed and removable accelerometers, etc.
Data Acquisition System
Only a decade ago A/D converters were still expensive and therefore typical monitoring system designs were based on either moving a portable logger around or by making star configurations with analogue cables connected to multiplexers at a central A/D converter at an acquisition unit. In this configuration problem with analogue noise and too slow sample rates for dynamic incidents often occurs.
Now that A/D converters have become relative inexpensive there is a tendency to use these converters right at the sensor points, forming so called distributed data acquisition networks. The benefit is that digital data can either be stored locally at the A/D converter or sent through a LAN without any quality loss.
Modern measurement systems for bridges tend to grow rather large. This forces the designer to take into account not only the measurement that is done, but also the topology of the network that connects the different measurement points.
Topology of network
In a simple situation when different sensors are close to each other, it is possible that independent sensor is connected to the data logger by its own dedicated cable. This solution is intuitive and easy to implement, but it becomes complex to manage when the number of sensors exceeds to over 25 and the distance is more than 80 meters.
For larger networks some form of serial topology is necessary. This means a structure where one single cable runs through all the sensors and they share this cable connection. This arrangement works painlessly up to structure sizes of say 1000 m. after that it is easy to split the network into several sub networks connected to a long fibre optic main cable. The fibre optical truck can also be structured as a logical loop which means that even if the fibre is damaged at any point, still all the sensors points are accessible, ensuring a high level of redundancy.
Fibre optic cables (FOC) are an easy way to control several common problems with long wired networks. It eliminates problems like short-circuits or energy surges and interference from a nearby lightning strike or electrical or magnetic fields. The downside of FOC is that the costs of connecting to fibre cables are still rather high. It is better to connect the sensors that are close to each other in a wired sub network and then to let the data signal jump to the FOC in an easy to control and well screened position.
The design of the main fibre and the small sub networks ensures high redundancy and makes it easy to isolate problem areas for maintenance. When the number of measurement points goes beyond 4000 the maintainability and ability to isolate problematic areas becomes a major factor. The larger the system the more important it is to keep things simple and easy to control.
The normal mix of measurements often has fast and slow measurements close to each other. For example accelerometers, strain gages, wind vanes and temperature sensors. These would normally be measured with speeds of 100 Hz, 10 Hz, 1 Hz and at every 10 minutes respectively. It is important to be able to collect the data from, for example strain gages and accelerometers in synchronization with each other, so that it is possible to cross-correlate the wind and structural vibrations and note what kind of stresses it causes on the structure.
Data Communication
The Data Acquisition Units (DAU or Processor) shall be installed in the bridge-deck or bridge towers and will be used for the collection and pre-processing of signals from the sensory system.
- The local cabling network system refers to the cabling network (shielded instrumentation cables) connecting and transmitting signals from sensory system to respective DAU’s.
- The global cabling network system refers to the fibre optic cabling networks installed in the bridge-deck or tower-shaft that are used for the transmission of digitized data from DAU’s, GPS reference stations, Weigh in Motion systems and digital video equipment to the SCADA (Supervisory Control and Data Acquisition) Room.
Data Processing and Control System
The master screen can be either a desktop display with the ability to transfer between different functions quickly and easily, or a large display wall which can preferably be divided into three large screens, build up of standard display modules, with the following functions:
- Provide overall control of the DAUs through the Data Acquisition System (DAS) backbone network, regarding data acquisition and processing, data transmission and filing control, data archiving and backup, and all display and operational control.
- Post-processing and analysis of the collected data from the DAS.
- Generation of instant monitoring reports regarding the monitoring of loading sources and bridge responses.
User Interface (UI)
The man-machine-interface is made use of, for displaying views from the SHM systems in understandable and readable graphical screens called mimic panels. The SHMS operator stations display of structural events related to the maintenance of the bridge, as well as allows the provision of remote control of threshold values for each SHMS sensor system.
For a large SHM projects, the system will visualize in real time all collected information, in the most suitable way for an immediate and efficient representation (graphs, tables, videos), and will allow research, visualization and elaboration at user specified periods.
The large display wall can preferable be divided into three large screens, built up of standard display modules, with the following functions:
- Screen 1: Traffic events monitoring
- Screen 2: Technical systems status and events monitoring
- Screen 3: Safety systems status monitoring (Surveillance)
The screens can be freely used by the operator as desired. The required reports, either on real time basis or historical can be generated by the operator as and when needed. Generally web based User Interfaces are used for remote monitoring. The typical screen of an UI is illustrated in Fig.
Instrumentation of the bridge
The instrumentation essentially comprise of installation of the sensors at pre-determined locations on the bridge structure connected with different components such and A/D convertors and data loggers in the wired or wireless networks. The selection of the type of sensors and their locations are decided based on the inputs obtained in the Finite Element Analysis (FEA) model of the bridge to be monitored. A typical example of a bridge monitoring instrumentation scheme is illustrated in Fig.
Fig.User interface display of a typical mimic panel of a bridge monitoring system and alarms
The bridge responses can be recorded either discretely or continuously. The responses are recorded in a data logger which in turn can be transferred to a computer hard disc or can be accessed remotely using the web based user interface. These responses can be compared with that obtained from FEM model analysis in order to estimate the health of the bridge.
Fig4. Typical example of sensor locations in bridge instrumentation
Levels of structural health monitoring
The levels of structural health monitoring can be classified in to four categories from the basic level to most sophisticated levels as detailed below:
LEVEL I: This basic level SHM system- It is capable of detecting damage in a structure, but cannot provide any information on the nature, location, or severity of the damage. It cannot assess the safety of the structure.
LEVEL II: Slightly more sophisticated than Level I SHM systems-Level II systems can detect the presence of damage and can also provide information of its location.
LEVEL III: A Level III SHM system-It can detect and pinpoint damage, and can provide some indication of its severity.
LEVEL IV: This most sophisticated level of SHM systems- It is capable of providing detailed information on the presence, location, and severity of damage and it is able to use this information to evaluate the safety of the structural system.
Closing remarks
The foregoing discussions can be summed up in the following points:
-
Structural health monitoring systems can be a right tool to make the structures (bridges) 'smart'.
-
Due to its multi disciplinary nature, SHM should be provided by the personnel trained in various faculties of SHM.
-
SHM can be used for diagnostic and prognostic purposes and also for assessing the residual life of the structures.
In any situation the bridge management system must work so that it enables operators to understand and trust the information provided by the system and rapidly act on it regardless of tools, time and space.
References
-
Structural Health Monitoring Systems - Futurtec OY, Finland - 2006
-
Technical literature on SHM, Savcor Tempo Oy - Futurtec Division
-
Ramesh M N , Chandramouli S.V. ‘ SHM for civil Infrastructure - an overview’ - 2008
About Author
 |
Mr. M. N Ramesh was born on 30th Jan 1956 and Graduated from Mysore University in 1976. Mr Ramesh is Presently, Executive Director of Ecmas Construction Chemicals Pvt. Ltd. He also established Enstrectura Consultants, where he works as Principal Consultant - Remedial Engineering. He has over 35 years of professional experience. His areas of interest are : Concrete technology, Construction Chemicals, Remedial Engineering, Geo technical Engineering, Pre-stressed concrete, Structural Health Monitoring, and Electro-Chemical Repairs. He has previously worked with HSCL, EIL, Metca US Inc, Reich Turbo GmbH, TRFI and Fosroc in senior positions both in India and abroad.
|
He was a CEO of Savcor India Pvt. Ltd, a fully owned Indian subsidiary of Savcor Group Ltd of Australia / Finland which he established in 2009, and was a Director in the Board of BBR India Pvt. Limited which is a part of a Swiss multinational - BBR .
He is Past Chairman of Indian Concrete Institute (ICI)-KBC, VP (South) of ICI, was a member of editorial board of ICI Journal. Mr. Ramesh was Member of CED 41 Committee of BIS and has Over 50 technical publications. He is Life Member of Indian Concrete Institute, American Concrete Institute, Non-destructive testing society of India, Fellow of Association of Consulting Civil Engineers (India). He is Rotarian with Paul Harris fellowship.
He can be contacted on - mnramesh@enstrectura.com