Experimental Investigation on Effect of Corrosion in Reinforced Concrete Beams
Abstract
Corrosion of reinforcing steel may be cited as the most detrimental effect endangering the structural performance in terms of load bearing capacity and ductility characteristics. Present research on National Bureau of Standard (NBS) RC beam specimens includes evaluation on the performance of Ordinary Portland Cement (OPC) and Portland Pozzolona Cement (PPC) concrete beam specimens under accelerated corrosion technique. Load versus deflection and crack width behavior is studied for different levels of corrosion i.e., 0%, 2.5%, 5%, 7.5% and 10%. From the results it is observed that as the corrosion level increases deflection increases while crack width rapidly increases for higher level of corrosion.
INTRODUCTION:
Construction of structures involves the use of structural steel and reinforced cement concrete (RCC). Rebar corrosion in concrete is one of the major problems in the durability criteria. However the breakdown of the passive firm film layer and consequently corrosion initiation takes place most frequently in the presence of chloride ions at the rebar level (Pradhan and Bhattacharjee, 2009, Shetty and Venkataramana, 2011).
In case of corrosion, formation of an oxide of iron due to oxidation of the iron atoms, in solid solution, is a well known example of electrochemical corrosion, commonly known as rusting.These oxides are usually weaker than steel.They are loosely attached and spall off from the surface (Figure 1).This leads to reduction in strength and reliability of structures.During the process of corrosion, weight of material decreases and depth of corrosion layer/pits increases.
Figure 1: Corrosion view on concrete structure (Sarah Rippin, 2013)
One of the most important prerequisites of reinforced concrete construction is adequate bond between the reinforcement and the concrete. Bond is an interaction mechanism which transverse the load from surrounding concrete to steel, since load is rarely applied on to the steels directly (Shetty et. al. 2013).
Present study aims to investigate the effect of corrosion on performance of RCC beams, since the
reinforcement corrosion is a major concern. The main highlights of the study are:
- Accelerated corrosion using impressed current technique is adopted to achieve the desired corrosion level within a short duration.
- NBS test beams are employed to load deflection behavior and crack width behavior of OPC and PPC concrete beam specimens are observed under two point loading flexural strength test.
- Different corrosion current densities are considered to obtain different percentage of corrosion levels.
EXPERIMENTAL INVESTIGATIONS:
Details of experiments, materials used, and method of testing are explained below.
1. Materials
Materials used for the experimental investigation are as follows:
Cement: Ordinary Portland cement (OPC) 43 Grade and Portland Pozzolona Cement (PPC) was used. It was tested as per IS: 8112-1989 for OPC (Table 1) and IS 1489 (Part-I):1991 for PPC Table 2) recommendations for the cement
Fine Aggregate: Physical tests on fine aggregates were conducted (Table 3).
Coarse Aggregate: Size of aggregate used was 20mm downsize and 12.5mm down size angular type coarse aggregate. The results are tabulated in Table 4.
Table 1: Test results of OPC
|
Sl No
|
Test Parameters
|
Results
|
As per IS 8112:1989
(Specifications for 43 Grade OPC)
|
|
1
|
Initial setting and
final setting time
|
75 min and 260 min
|
Not less than 30 min.
and not more than 600 min
|
|
2
|
Specific gravity
|
3.1
|
|
|
3
|
Compressive strength:
|
|
|
| |
3 Days
|
24.09N/mm2
|
Not less than 23 N/mm2
|
| |
7 Days
|
34.48N/mm2
|
Not less than 33 N/mm2
|
| |
28 Days
|
46.85N/mm2
|
Not less than 43 N/mm2
|
Table 2: Test results of PPC
|
Sl No
|
Test Parameters
|
Results
|
As per IS 1489 (Part-I):
1991 (Specifications for PPC)
|
|
1
|
Initial setting and
final setting time
|
76 min and 270 min
|
Not less than 30 min.
and not more than 600 min
|
|
2
|
Specific gravity
|
2.91
|
|
|
3
|
Compressive strength:
|
|
|
|
3 Days
|
16.64N/mm2
|
Not less than 16 N/mm2
|
|
7 Days
|
26.54 N/mm2
|
Not less than 22 N/mm2
|
|
28 Days
|
39.84 N/mm2
|
Not less than 33 N/mm2
|
Table 3: Test result of fine aggregate used for concrete mix
|
Sl No
|
Test Parameters
|
Results
|
|
1
|
Specific gravity
|
2.6
|
|
2
|
Water absorption
|
2.0%
|
|
3
|
Moisture content
|
5.0%
|
|
4
|
Grading
|
Zone I
|
Table 4: Test result of coarse aggregate of 20mm down size used for concrete mix
|
Sl No
|
Test Parameters
|
Results
|
|
1
|
Specific gravity
|
2.8
|
|
2
|
Water absorption
|
0.5%
|
|
3
|
Moisture content
|
Nil
|
|
4
|
Shape
|
Angular
|
Reinforcing steel
Tensile strength of reinforcing steel bar was tested using Universal Testing Machine (UTM). Stress-strain curves for 25mm Thermo Mechanically Treated (TMT) Fe-415 reinforcing steel bar was obtained by plotting tension test data. The yield strength and ultimate strength are 485N/mm2 and 589N/mm2 respectively.
2. Preparation of test specimens
NBS beam specimens of size 2.44mx0.457mx0.203m were designed as under reinforced sections as per IS 456-2000 for the present study. A total of thirty specimens were cast. Mass concreting was adopted as specimens were of large size. TMT rebar of 25mm diameter bar was placed at a cover depth of 50mm from bottom, 12mm hanger bar at top and side bars were provided with a stirrups of 8mm diameter (Figure 2).
Concrete mix for M30 Grade was prepared using OPC and PPC cement, fine sand and aggregate (20mm & 12.5mm) as per IS 10262:2009. Mix proportion of 1: 1.77: 2.87 was used for both OPC and PPC concrete. Water cement ratio of 0.45, with an addition of 2ml/kg of a commercially available chemical admixture was used. Slump obtained was 58mm. Specimens were kept in water for 28 days of curing. Compressive strength of 34.44N/mm2 and 32.57N/mm2 were achieved at the end of 28days for OPC and PPC concrete specimens respectively.
Before placing of concrete in beam moulds, one blue colour multi-strand copper wire of 4cm2 cross sectional area was connected at one end of rebar, and soldered to reinforcement bar and also covered with M-seal to prevent corrosion at that area. This wire is protruded to the surface level to induce electric current.
Figure 2: Reinforcement details of NBS beam specimen [Paul, (1978)]
Similar steps were followed at the other end and one black colour, multi-strand copper wire of 2cm2 cross sectional area was connected to reinforcement bar, which helps in the monitoring process of corrosion rate.
3. Accelerated corrosion technique
After curing of beam specimens, specimens were shifted to the corrosion tank to induce desired corrosion levels i.e. 2.5%, 5%, 7.5% and 10%. Electrochemical corrosion technique was used to accelerate the corrosion of steel bars embedded in beam specimens. Specimens were partially immersed in a 5% NaC1 solution for a duration of 8 days; direction of current was arranged such that, rebars embedded inside the concrete specimens served as anode. The steel plate which was placed along the length of beam functions as cathode. Current required to achieve different corrosion levels can be obtained using Faraday’s law (Eq. 1) (Ahmad, 2009). Amount of current i.e. 2.5A, 5A, 7.5A and 10A were applied to obtain the required degree of corrosion level i.e. 2.5%, 5%, 7.5%, and 10%. For each trial, three specimens were considered. A schematic representation of corrosion test set-up used for accelerated corrosion process is shown in Figure 3(a). View of accelerated corrosion of beam specimens is shown in Figure 3 (b).
Calculation of amount of current required to obtain different corrosion levels From Faraday’s law,
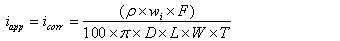 |
(1) |
where; , T= time in seconds,
 , , |
Initial weight of steel Wi= 20,000g; Wi=final weight; F=96487 Amp-sec;
W (equivalent weight of steel)= 27.925g,
4. Corrosion rate measurements
After completion of accelerated corrosion, corrosion rate was monitored with the help of applied corrosion monitoring instrument (Figure 4 and Figure 5) based on linear polarization resistance (LPR) method.
The corrosion current density was calculated by using the Stern-Geary formula.
 |
(2) |
where, = corrosion current density (μA/cm2); = polarization resistance (kΩ cm2); = 26 mV (for steel in active condition this value is normally used).
Figure 3(a): Schematic representation of accelerated corrosion of beam specimen
Figure 3 (b): Accelerated corrosion of beam specimens
Figure 4: Corrosion monitoring set up
Figure 5: Corrosion monitoring instrument
5 Test Setup
Beam specimens were tested under two point loading condition (Figure 6). Dial gauges were fixed at the top side as shown in Figure 7 (two at load points and one at centre) to measure the deflection for each load increment. The load was applied at15kN increments. Proving ring of 50 tonne capacity was used to note the applied load.
Figure 6: Test set up of NBS beam Specimen
Figure 7: Position of Dial gauges
Maximum crack widths for different degrees of corrosion levels were measured. Crack width was assessed using Concrete Crack Microscope instrument, shown in Figure 8. The least count of the crack microscope is 0.02 mm.
Figure 8: Concrete Crack Microscope
RESULTS AND DISCUSSION
1 Measurement of corrosion current density
Corrosion rate is measured in terms of corrosion current density, icorr, and is a quantitative index, which represents an overall estimate of the corrosion attack on reinforcement. The icorr is measured electrochemically.
Corrosion current densities were calculated for each specimen for different grids and average was considered to calculate the weight loss (%). Obtained corrosion levels (%) for applied current are shown in Figure 9. Average current density values were tabulated in Table 5 and Table 6.
From Figure 9, corrosion level (%) or weight loss percentage achieved for the applied current
(A) can be calculated as:
y= 0.96x-0.22 R² = 0.995 (PPC Concrete) (3a)
y = 0.98x - 0.54 R2=0.998 (OPC Concrete) (3b)
where; x=applied current (A) and y= achieved corrosion level (%)
Figure 9: Variation of Applied current with corrosion level
Table 5: Corrosion current density  of NBS beam in OPC concrete
Corrosion current density
|
|
Cement
Type
|
OPC
|
|
Corrosion
level(%)
|
grid
1
|
grid
2
|
grid
3
|
grid
4
|
grid
5
|
Average
|
|
2.5
|
130.67
|
128.57
|
129.09
|
128.04
|
128.04
|
128.88
|
|
5
|
248.70
|
244.49
|
240.8
|
236.06
|
232.90
|
240.59
|
|
7.5
|
389.92
|
386.23
|
383.59
|
390.97
|
387.81
|
387.70
|
|
10
|
517.43
|
514.79
|
507.42
|
515.85
|
510.05
|
513.11
|
Table 6: Corrosion current density of NBS beam in PPC concrete
|
Corrosion current density
|
|
Cement
Type
|
PPC
|
|
Corrosion
level(%)
|
grid
1
|
grid
2
|
grid
3
|
grid
4
|
grid
5
|
Average
|
|
2.5
|
111.18
|
107.49
|
118.03
|
112.23
|
103.28
|
110.44
|
|
5
|
222.88
|
216.56
|
219.20
|
217.09
|
223.41
|
219.83
|
|
7.5
|
379.38
|
365.68
|
375.69
|
366.73
|
375.16
|
372.53
|
|
10
|
503.73
|
496.35
|
494.24
|
501.62
|
499.51
|
499.09
|
2 Load deflection behavior, Ultimate load carrying capacity and Crack width of Specimens.
In the present study, 3 control specimens and 12 corroded specimens (3 sets each for 2.5%, 5%, 7.5% and 10% of corrosion) for both OPC and PPC concrete beam specimens were tested using two-point loading to determine the flexural strength and crack width behaviour.
Results of ultimate load and maximum crack width against corrosion level are shown in Figure 10. As the degree of corrosion level increases load carrying capacity decreases (Figure 10 a). It is seen that for every percentage increase in corrosion level there is about 1.6% decrease in load carrying capacity.
From Figure 10 (b) it is observed that variation in crack width with corrosion level is small (0 to 5%) in the initial stages. After 7.5% corrosion level, crack width increases rapidly.
Experimental results show more load carrying capacity than that of the theoretical load obtained using (eq. 4 and eq. 5) for both OPC and PPC Concrete beam specimens [Figure 10 (a) and eq. (4) and eq. (5)]
Figure 10: Effect of different corrosion levels on
(a) Ultimate load carrying capacity
(b) Maximum crack width
Note: Theoretical calculations of load carrying capacity of Beam Specimen OPC concrete:
PPC concrete:
Similarly we obtain,
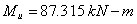 |
and (5) (5) |
4 Load deflection behaviour of NBS beam
From Fig. 11 it is observed that as degree of corrosion level increases deflection also increases. This may be due to change in material property of corroded reinforcement. As steel reinforcement yielded, bond between reinforcement steel and concrete failed, and the deflection increased with higher corrosion percentage. Also, with the increase of the corrosion level, the failure mode of RC beam changed from ductile failure to brittle failure.
Figure 11: Comparison of effect of corrosion on central deflection behavior of OPC and PPC concrete beam specimens
CONCLUSIONS
-
Reinforcement corrosion leads to the decline of load carrying capacity of RC beam specimens. In the present experiments, every percentage increase in corrosion level, load carrying capacity drops by about 1.6%.
-
Effect of corrosion on crack width is small in the initial stages (0 to 5%) of corrosion. After 7.5% corrosion level, crack width increases rapidly.
-
As degree of corrosion level increases deflection also increases. This may be due to change in material property of corroded reinforcement. Bond between reinforcement steel and concrete fails, and the deflection increases with corrosion level.
-
PPC concrete beam specimens perform better than OPC concrete beam specimens both in case of load carrying capacity and in crack width behavior.
-
It is observed that PPC concrete is better suitable in coastal environment where reinforcement corrosion is a major concern.
REFERENCES
- Ahamad, S. (2009), “Techniques for inducing accelerated corrosion of steel in concrete”, The Arabian Journal of science and Engineering, 34(2C), pp. 95-104.
- IS 1489 (Part 1) - 1991, Portland pozzolana cement - specification (fly ash based) Specification Bureau of Indian standards, New Delhi.
- IS 456 (2000), Indian standards code of practice for plain and reinforced concrete (forth revision), Bureau of Indian Standards, New Delhi.
- IS 8112 (1989), 43 Grade Ordinary portland cement - Specification Bureau of Indian standards, New Delhi.
- IS: 10262 (2009), Recommended guidelines for concrete mix design, Bureau of Indian Standards, New Delhi.
- Paul, R. J. (1978), “Top-bar and embedment length effects in reinforced concrete beams”, Master Thesis, Department of Civil Engineering and Applied Mechanics, Mc Gill University Canada.
- Pradhan, B. and Bhattacharjee, B. (2009), “Performance evaluation of rebar in chloride contaminated concrete by corrosion rate”, Construction and Building Materials, 23(6), pp. 2346-2356.
- Sarah Rippin, (2013). Concrete Best Practices, Concrete Industry News http://blog.kryton.com/2013/02/sneaky-grains-of-salt-can-wreak
- Shetty Akshatha and Venkataramana K. (2012). "Effects of corrosion on bond strength and load carrying capacity of RC members: an experimental investigation". NITK Research bulletin, 20(2), pp. 6-12.
- Shetty Akshatha, Katta Venkataramana, Babu Narayan K.S., (2013). "Effect of corrosion on degradation of RC members". International review of Applied Engineering Research, 3(1), pp. 55-66.
AUTHORS
|
Akshatha Shetty
(Corresponding Author)
Research Scholar,
Department of Civil Engineering,
National Institute of Technology Karnataka,
Surathkal, Mangalore 575 025
Email: akshathashetty16@gmail.com
|
Dr. Katta Venkataramana
Professor and head,
Department of Civil Engineering,
National Institute of Technology Karnataka,
Surathkal, Mangalore 575 025
Email: ven.nitk@gmail.com
|
|
Dr. K.S. Babu Narayan
Professor, Department of Civil Engineering,
National Institute of Technology Karnataka,
Surathkal, Mangalore 575 025
Email: srilalisuta@rediffmail.com
|
Dr. G. R. Reddy
Head, Structural and Seismic Engineering Section
Bhabha Atomic Research Centre,
Reactor Safety Division
Trombay
Mumbai 400 085
Email: rssred@barc.gov.in
|