Transit Based City Planning and Design
A.K. Jain1
The pace of rapid motorization is changing India's urban pattern. The ownership of the private vehicles in urban areas is growing three to four times the population growth rate, which is posing the threats of traffic congestion, accidents, pollution, noise stress, etc. To cope up with the increasing traffic, it is common to witness the widening of roads up to the brim and parking on the sidewalks. The construction of flyovers, underpasses and grade separators is not able to cope up with volume of vehicles on the roads. The cycles, and non motorised Vehicles (NMVs) lack dedicated and safe right of way. As a result of the skewed growth of transport, apart from the traffic jams, gridlocks and accidents, the greenhouse gas emissions and pollution are increasing exponentially, contributing about one-fourth of greenhouse gases and about two-thirds of the SPM in major Indian cities.
With less than 1 per cent of the world’s vehicle population, India accounts for 6 per cent of world’s road accidents and 10 per cent of world’s road fatalities. More than 1.41 lakh people die in road accidents every year. They are mostly pedestrians or cyclists for whom there is no spaceon the roads, though 30 to 40 per cent of citizen walk or cycle to work. Public transport is largely seen as the transport mode for the poorer sections of the community, who do not own personal transport.
Inefficient urban transport impacts the competitiveness of the economy by adversely affecting the labour market and by increasing the commuting time for goods and passengers. Private transport and public transport are the two sides of the same coin and the interdependence and correspondence between the two cannot be overlooked. The urban form and structure, land use and development controls impact and influence traffic and transportation pattern, volume/capacity, length and width of the roads, mobility of the goods, pedestrians, cycles and other NMVs, transport terminals, nodes and parking demand Urban transport impacts the sustainability of cities-social, economic and ecological, i.e. built and natural environment. This is a major challenge which demands that the urban transport be cleaner, calm and adapt to the effects of climate change. This needs a sustained and efficient use of resources for urban transportation which have low carbon emissions. The transport services should be accessible to all and provide safer, affordable and barrier free access and services irrespective of income, social and physical differences including gender, ethnicity, age and disability.
Liveable and Accessible City.
Liveable and accessible cities are compact, walkable and sustainable, which are designed to enhance local identity, provide diverse housing options, land use efficiency, generate local employment and provide comfortable, safe, affordable, reliable and non-polluting public travel modes. Most of the local facilities are reachable by a convenient 5-minute (400 to 500 meter) walking, with dedicated paths for walking and cycling. Neighbourhood facilities, shops, schools, parks, clubs and city centres are located along the pedestrian, cycle and public transport corridors. The urban form plays an important role in the urban mobility by accommodating all modes to travel, including walking, cycling, public transit and driving, which connect amenities and people by a safe, efficient and attractive road network, with generous footpaths and trees. Buildings are located directly onto streets fronts (rather than set back, behind parking), that ensures passive surveillance of public spaces that increases personal safety. Streets are provided with service roads and pooled parking area at every kilometre that keeps the path and building front free from on-street parking.
The urban hierarchy is worked out on modular basis and accessibility to various functions so that community, especially children, women and aged can walk to their places of education, recreation, shopping or work. As the distance increases, the public transport should provide access to the place of destination.
Source: Barton H. etal (2003) Shaping Neighbourhoods, Spon Press, London
The vital components of an accessible city are:
• City Structure that supports walkability, cycling and public transport.
• Public Transit system.
• Travel Demand Management (TDM) 3
• Transit Oriented Development (TOD)
Access is directly related with distance, time and mode of travel. As such the places of frequent visit should be located closest to the place of residence, aiming at a walkable, sustainable development
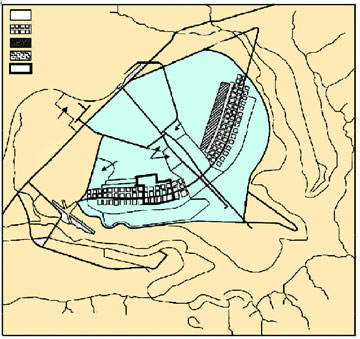
The concept of community module and urban hierarchy had been the basis of planning. Egil’s proposal for Furttal near Zurich indicates it clearly. The Mencian approach towards community organisation revolves around the segregation of local, city and national connections and also separation of residential/passenger/commuter from goods traffic. In plan of Runcorn New Town in UK is based on public transit system and the formation of walk able communities. Brasilia, the new capital of Brazil, had been planned by Lucio Costa in the shape of a cross, as was used in the ancient city of Alexandria. This form provides an efficient pattern of transportation, segregating residential and non-residential traffic to a large extent. Le Corbusier in his Chandigarh Plan adopted the sector measuring 800X1200 m, which is the building block of the city. This has public transit on its periphery from where one can walk down to any place within the sector in 5 to 10 minutes. The starting point of planning of Chandigarh was organisation of a 4 transport network based on V-7 hierarchy of road network and sectors (800 × 1200 m) with an interconnected green corridor, cycle tracks and pathways.
Diagram of Egli's proposal for Furttal near Zurich, Switzerland. The proposal follows Egli's description of Bardet's concept of urban hierarchy. Egli shows a hierarchy of family, neighbourhood, group, district, town and city.
Source: Egli, E. Geschichte des Stadtebaues Erlenbach-Zurich Eugen Rentsch Verlag 1967
C.A. Doxiadis, the celebrated Greek planner, planned Islamabad, the new Capital of Pakistan. He developed the concept of evolving city, where the city centre grows along with its phased development. Charles Correa developed the plan of New Mumbai along a MRT corridor, which he called the string, along with a series of new cities, the beads, in the region. The junction of transport nodes constitutes the regional transport and business node. The commercial centres in the Master Plan of Delhi are based on segregated land use by way of polynodal, polynuclear concept with a theoretical organisation of Districts, Communities and Neighbourhood. In actual practice this had been a cause of centrifugal, centripetal transport network with gridlocks all over. The growth of large cities had been usually concentric, leading to congestion in the central areas and numerous intersections. The development of the Ring Roads and building flyover/grade separators provide only temporary relief to the perennial congestion. Often it is not possible to restructure the city completely, but mixed land use, compact and smart development controls, transit oriented development, car, pools, efficient public transport and taxies, improving road capacity and using Intelligent Transport Systems/Management can provide solutions to the problem.
Diagram showing a 'Mencian' approach towards arranging twelve balanced communities, their public transport circuit and their road links to each other and a national road network. The ‘Mencian’ centre typically contains symbols of national unity and culture Runcorn New Town- the plan evolved on the basis of module of neighbourhoods accessed by rapid public transit route. The city form is based on public transport interlinked with community facilities, work centres and neighbourhood distributor road system
Source: Ling, A Runcorn New Town Master Plan, Runcorn Development Corporation, 1967
Population Related to Walking Distance
Diagram showing the figure 'eight' network of the public transport system. This leads to a simplified hierarchy comprising communities and only one centre, at the intersection of the loops.
Source: Ling, A Runcorn New Town Master Plan, Runcorn Development Corporation, 1967
Serving a neighbourhood of 2,000 population.
Sources, Ling, A. Runcorn New Town: Master Plan Runcorn, Runcorn Development Corporation, 1967
Brasilia, the new capital of Brazil, had been planned by Lucio Costa in the shape of a cross, as was used in the ancient city of Alexandria. This form provides an efficient pattern of transportation, segregating residential and non-residential traffic to a large extent
Le Corbusier: Master Plan for Chandigarh, 1951
1. Capital complex 2. Central business district
3. Hotels, restaurant and visitors centre 4. Museums and stadium
5. University 6. Wholesale market
7. Park bands extending through residential areas 8. Shopping street (V4)
9. Area for further expansion of the city for a population of 5,00,000
The starting point of planning of Chandigarh was organisation of a transport network based on V-7 hierarchy of road network and sectors (800 × 1200 m) with an interconnected green corridor, cycle tracks and pathways
Source: Boesiger, W (Ed.) (1999) Le Corbusier-Complete Works, Birkhauser Publishers, Besel
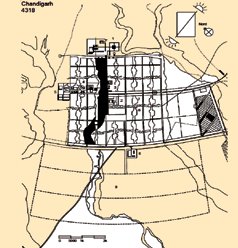
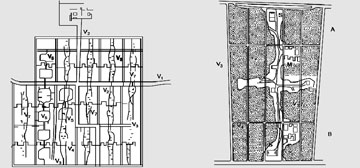
Le Corbusier's road classification. V1 cross country: V2 branch to city: V3 sector divide: V4 sector connectors: V5 local spine: V6 to buildings: V7 pedestrians
Source: Boesiger, W (Ed.) (1999) Le Corbusier-Complete Works, Birkhauser Publishers, Besel
Plan of Islamabad (Pakistan) by C.A. Doxiadis: 1. Rawalpindi town, 2. Residential districts, 3. Dynamic developing centre - public shopping and commercial centre, 4. Military zone, 5. Embassies, 6. Airport, 7. Old city, 8, bus terminal, 9. Green space, 10. Industrial area, 11. Railway area. Arrows show direction in which the city grows.
Concept of Evolving city by Doxiadis adopted in Islamabad
Source: Doxiadis, C. (1965), 'Islamabad, the Creation of a New Capital', Town Planning Review, 36(1), pp.1-
The concept of New Bombay (Mumbai) developed by Charles Correa is based on 'beads in a string' pattern, the string being the MRT corridor tying up the nodes, that is, new cities in the region
Source: Frampton, Kenneth (1996), Charles Correa, Perennial Press, Mumbai
The five tier commercial centres in the Master Plan of Delhi were based on segregated land use by way of polynodal, polynuclear concept with a hierarchy of Districts, Communities and Neighbourhoods. This had been a cause of centrifugal, centripetal transport network with gridlocks all over.
Source: Jain, A.K., 2012, Sustainable Urban Transport and Systems, Khanna Publishers, New Delhi
Various forms of city structure can be developed for efficient public transport, as well as for organisation of community module, greens and social infrastructure.
Transit Based Urban Structure
 |
 |
Mobility is the lifeline of urban living. It is necessary that the urban structure and land use pattern make day to day activities accessible by walk and there is a close relationship between residence and place of work. The concepts of Transit Oriented Development (TOD), Transport Demand Management (TDM) and Corridor Development form the basis of walk to work, compact and smart urban planning, which establishes a close relationship among the residential, employment and service locations. For Integration of land-use and transport planning, mixed land use helps in minimising the need to travel. A walkable community provides a fundamental building block in creating a sustainable urban form. As such, a city comprises a network of overlapping communities, each focused on a local centre, within which people can access on foot most of the facilities and services for day-to-day living. Each of these communities is defined by the walking catchment or "ped-shed", which is generally around 500 to 800m, or a 5 to 10-minute walk. Walkability is about making it possible for the average citizen to be able to lead his/her life by relying largely on walking for day to day activities. This needs an urban design consideration, such as density, mixed use, street life, pedestrian crossings, tree shade, public places and so on. All these parameters are important in their own right but walkability is a simple way to encapsulate this philosophy of integrated transport and urban planning.
Organisation of land use, circulation pattern and decisions regarding density, Floor Area Ratio and other controls should be around the public transport system, so as to which reduce the need of personal vehicles. The spatial model based upon the principle of "less travel, more energy saving", promotes a compact development. This can also significantly help in saving fossil fuel consumption, climate change and environment. Critical instruments for this option include land use synergy with public transport, infrastructure development, mixed land use and e-governance. Communications, such as telecommunications, electronic mail, video-conferencing, radiopaging, mobile-phones, computer networking, e-mail, etc. provide the alternatives to physical movement.
 |
The World Development Report (2009) of the World Bank cites the example of Atlanta and Barcelona. Atlanta has a metro network of 74 km while Barcelona has 99 km. These may seem comparable but per capita CO2 emission for Atlanta is 10 times that of Barcelona. The difference is mostly explained by Barcelona being more compact while its American rival is spread out. As a result, less than 4% of Atlanta's population lives within reasonable walking distances of a metro station compared to 60% for Barcelona. If Atlanta now tries to give its citizen the same accessibility, it would have to build 2800 new metro stations and 3400 km of new tracks. The lesson learnt is that public transport, land use and walkability are interlinked and need to be planned together.
Comparison of urban forms and transport sector CO2 emissions in Atlanta (US) and Barcelona (Spain) Source: Lefèvre, 2009, citing Newman and Kenworthy, 1999.
Los Angeles: Low Density sprawl, Poor Ridership of Public Transport 43
Barcelona: Public Transit Based Urban Form
Low Carbon, Green Mobility
Motorization contributes to an increase in transportation energy intensity and consumption of fossil fuels. The oil-based transport energy impacts significantly on the natural environment (energy and mineral extraction and use, hydrological cycle and water quality effects, consumption of agricultural land and natural habitats through urban sprawl, air pollution, etc.) and the built environment (noise, pollution, traffic accidents, community severance). In Delhi 72 per cent of emissions (suspended particulate matter) are due to motorized vehicles.
Foremost among the impacts of motorization is the conversion and subsequent loss of agricultural and natural green areas. Extensive urbanization and primacy of metropolitan cities through the transformation of agricultural land has led to an increase in traffic congestion, demand for roads and parking, consumer costs, accidents and energy consumption. This is evident in and around metropolitan cities, like Delhi, where several new urban centres have emerged within 50 km radius, such as Gurgaon, Manesar, Kundli, Sonipat, NOIDA, Greater NOIDA, Ghaziabad, Faridabad, etc.
The fast-growth of private vehicles is seen as a most intractable source of carbon emissions. Its implications are evident in Delhi where 90 per cent of total motorized transport, i.e. private vehicles, carry 31 per cent of vehicular trips and are responsible for 90 per cent of emissions. Recent empirical data indicates that pollution loads are marginally reducing, mainly due to vehicular technology in terms of emission norms (such as Bharat Stage Bharat Stage II and Bharat Stage III/Euro norms), and the use of CNG. However, the potential gains of stringent emission control and public transit system are yet to be fully realized which faces several barriers, such as increasing volume of vehicles and idling due to congestion on roads. Besides engine norms and fuel policy, it is necessary to reduce the vehicle kilometres travelled and trip length by travel demand management, land use and transport synergy, car pooling and integrating public-private modes of urban transport. Environmental footprints of private motor vehicle also include the amount of resources (including embedded energy) used in their production, amount of waste produced by their disposal, and continued use of fossil fuels. The electric car is being promoted through the government subsidy, however, the production of thermal energy is still a large producer of carbon emissions.
Environmental Sustainability of Different Modes of Transport
Legend: 1 = very bad, 2 = bad, 3 = average, 4 = good, 5 = very good
Source: Vuchic, R.V (1981), "Urban Public Transportation Systems and Technology", Prentice Hall, Englewood Cliffs, New Jersey,. cited by Raman Parti and Surjit S Katoch, Efficient Transportation Planning and System Integration for Healthy Environment of Large Cities, PROCEEDINGS OF INTERNATIONAL CONFERENCE ON ENERGY AND ENVIRONMENT MARCH 19-21, 2009 ISSN: 2070-3740
Comparison of Energy Efficiency of Railways and Roads
Source: Railway Board and World Bank Study
The present emission of 4.5 m per capita per year of private motorised transport is predicted to double within next 10 years, if they continue to grow at present pace of 8 to 10 per cent per year. Studies show that to transport one ton of cargo per kilometer, road transportation needs 4 to 5 times the energy that is needed by a train. The energy used by a car to carry a passenger over one kilometer is 3 to 4 times that of a bus. Greenhouse gas emission per passenger of public transport (bus, rail and trams) is about one-twelfth that of a car. Although NMTs (including walking) are ideal from the point of view of emissions, in terms of kilometers travelled, these cover only 1 to 2 per cent of the total kilometers travelled, even if the proportion of trips are as high as 40 to 50 per cent, as in Delhi and other megacities. It implies that environmentally sustainable transportation and reduction of energy use is essentially a walkable community and a greener transportation, which helps in reduction in use of fossil fuels and conservation of natural resources. Walkable community is compact and smart with home based offices. Sustainable fuels, energy, water, waste management, sanitation and mobility should be the basis of planning and growth, along with extensive use of IT and e-governance.
Newman and Kenworthy's hyperbola "Urban density and trasnport-related energy consumption" shows a high correlation between urban density and intra-urban transport-related energy consumption per capita.
Source: Newman, Peter, R Kenworthy, 1999, Sustainability and Cities: Overcoming Automobile Independence, The Centre for Resource Economics, Washington DC, USA.
These results are due to density being highly correlated with modal distribution and the intensity of automobile use, as shown in Table given below:
City typology based on average urban density and transport
MPT: Motorised Public Transport,
PT : Public Transport,
NMT : Non-motorised Transport,
Density: Number of inhabitants and jobs per hectare of net urban surface (omitting green and water surfaces)
Source: Newman, Peter, R Kenworthy, 1999, Sustainability and Cities: Overcoming Automobile Independence, The Centre for Resource Economics, Washington DC, USA.
The challenge of urban planning is to reduce the vehicle kilometer travelled and trip length by travel demand management, land use policy and by complimentarily and integrity of various modes of transport.
Typical greenhouse gas emissions
Transport Contributes up to 70% of SPM and other Urban Pollution
Integrated land use planning considers Transport Demand Management (TDM) solutions, such as, rideshare program, mobility management programs, shared parking and user charges. These aim to encourage people to reduce car trips by incentives such as and support to reduce peakperiod driving, including better cycling facilities and flexible working hours. The core of integrated planning is to improve public transit and increase its service efficiency by dedicated corridors (e.g. BRT) better vehicles and stations, more frequent services, reduced crowding, improved walking conditions of transit stations, and priority to high occupant vehicles (buses and carpools) .
Transit Oriented Development
As an integral component of transport and land use synergy, Transit Oriented Development (TOD) aims to reduce the need to travel and encourages walkablility together with maximizing the efficiency of the public transport system and non-motorised transport. TOD with the following attributes leads to congestion reduction, improved mobility options, road safety, energy conservation, emission reductions and transport /road infrastructure cost savings:
- Walk to work (W2W), "local hubs" within 10 minutes walking and cycling distance
- Integrated planning of urban transport/corridors
- Mixed land use, Rat ionalisat ion of land use and density
- Mult i-modal Integration of buses, trams, Metro rail, rail corridors and LRT.
- Potential of using subterranean space
- Communicat ion as a viable substitute for transportation.
- Encourage walking, cycles and NMV
- Safety of movement for children, pedestrians & elderly.
- Low noise and air pollut ion.
Transit Oriented Development does not believe in the myth that the only way to improve transport is to increase roadway capacity and provide better transport. It is a fact that there are diminishing marginal benefits from additional roadway investments. In order to promote use of public transport, the incentives are offered in terms of higher Floor Area Ratio, density, mixed/flexible land use along transport nodes and corridors. It involves the integration of Bus, metro, LRT and Rail stations, terminals, with surface dispersal facilities and services such as parking, taxi stands and street-scaping. The TOD aims to develop a linear, polycentric, polynodal corridor for dispersal of traffic and to decongest the city center having a concentric, centripetal and centrifugal traffic pattern. At the operational level it envisages the introduction of integrated traffic and transit operations, ITS for traffic, control and management and setting up of Unified Metropolitan/Regional Transport Authority for co-ordination in planning and implementation.
Image in page 21 Setting up of Unified Metropolitan/Regional Transport Authority for co-ordination
In Delhi a Unified Traffic & Transportation Infrastructure Planning and Engineering Centre (UTTIPEC) has been established under Delhi Development Act, 1957. Headed by the Lt. Governor, it provides a common platform for more than 30 public and semi-public organizations of the Central, State and Local Governments, like PWD, Railways, DMRC, DDA, Transport Departments, DTC, DMCs, DUAC, DIMMTS, etc., along with representatives of NGOs and public. It aims at:
• To study / coordinate the norms for Planning and Engineering Practices
• Traffic Road Safety Audit Guidelines (TRSAG)
• To coordinate a sustainable public transport system
• To evolve a parking policy and parking solutions.
• To develop and implement TOD guidelines and pilot projects
• Inventory of Corridor-wise Issues, Strategies and Enforcement
• Sharing of Traffic & Transportation Plans / database / information
• Protocols and norms for signage, street furniture, lighting, signals, hoardings, trees, roadside landscape, zebra crossings, pedestrian passages & commuter facilities.
• Evaluation - Public Participation-Feedback
• Coordination, Communications and Capacity Building.
• Guidelines of the Standard Operating Procedures (SOPs)
• Manuals for retrofitting of the deficiencies
Location Efficient Development and Transit Oriented Development is a set of planning practice to create more attractive, efficient and liveable communities. These can significantly improve accessibility and reduce per-capita automobile travel, by various specific design features as listed below:
• The community has a discernible activity centre. This is often a plaza, square or green, and sometimes a busy or memorable intersection. A transit stop should be located at this centre.
• Special attention is paid to protecting the public realm and creating quality public spaces, including sidewalks and paths, parks, streetscapes and public buildings. This helps create more community identity and cohesion, leading to stronger and healthier communities.
• Buildings at the centre are placed close to the sidewalk and to each other, creating an urban sense of spatial definition. Buildings towards the edges are placed further away and further apart from each other, creating a more rural environment.
• Most dwellings are within a five-minute walk (400-500 m) from the transport node. Streets are designed for walking and cycling, with sidewalks on both sides, bike lanes where needed, good crossings, traffic calming features used to control motor vehicle traffic speeds, and other features to encourage non-motorized travel.
• There are a variety of dwelling types. These take the form of houses, row houses, and apartments, such that younger and older, singles and families, the poorer and the wealthier can find places to live. Density averages 6-7 units per acre or greater.
• There are places to work within and adjacent to the neighbourhood, including shops, office buildings, banks, ATM, gym, nursery schools and live-work units.
• There are parks, trails and playgrounds near every dwelling. This distance should not be more than one kilometre.
• Thoroughfares are relatively narrow and shaded by rows of trees that slow traffic and create an appropriate environment for pedestrian and bicyclist.
• Parking is relegated to the rear of the buildings and usually accessed by alleys or lanes. The land use reforms can be implemented at various geographic scales at local level, site and block level, and city level. These reforms do not exclude automobile travel, but aim to increase transportation options and give priority to walking, cycling and public transit, which provide more direct travel between destinations. Increased connectivity has shown a reduced per capita vehicle travel and reduced traffic volumes as the people can conveniently go to work and shopping by walking and cycling and children can walk to school, parks, recreation centre and gym. These concepts can be incorporated into existing urban communities. Existing residential and commercial areas can implement traffic calming and pedestrian improvements, reallocate road space, use parking management and encourage location efficient development.
Source: Unified Traffic & Transportation Infrastructure Planning and Engineering Centre (UTTIPEC), Delhi
Image in page 23 Public Space- Pedestrian Realm
Source: Unified Traffic & Transportation Infrastructure Planning and Engineering Centre (UTTIPEC)
Transit Oriented Development- Delhi 45
Image in page 24 Skeleton Parking Cluster at Every km to avoid Parking Spillover on
Footpaths and Building Fronts
Source: Unified Traffic & Transportation Infrastructure Planning and Engineering Centre (UTTIPEC) Delhi
Travel Demand Management (TDM)
Travel Demand Management aims to reduce the need to travel and bring people and places together. Some prominent measures of TDM include the following:
• Traffic free zones
• Peak hour congestion Management, Minimum occupancy vehicles, Cordon pricing
• Flexible laning
• Traffic Signals Management
• Parking Policy
• Park-n-ride facilities
• Service and capacity enhancement
• e- governance
This needs a review of current planning regulations and development practices. For example, zoning codes often require more parking and wider streets than considered appropriate. Zoning codes also discourage commercial activities and secondary living units in residential areas, and require large setbacks for homes and businesses that reduce densities and land use mix. Another barrier is that the real estate industry is highly segmented by land use category (such as singlefamily housing, multi-family housing, retail, office and warehouse). Each category has its own practices, markets, trade associations, and financing sources, which requires a more integrated approach to development.
Residents in well-designed neighbourhood with good walkability, mixed land use, connected streets, and local services tend to drive 20-30% less than residents in automobile dependent areas, and even greater vehicle travel reduction may be possible if urbanism is coordinated with TDM strategies, such as transit improvements, car sharing, road pricing, parking, management and commuter trip reduction programs. This can provide a variety of economic, social and environment benefits.
Location efficient development can reduce automobile dependency and use, providing cost savings and reductions in automobile travel that provide social benefits, such as reduced traffic congestion, parking costs, accident risk, pollution and urban sprawl. It can significantly improve liveability, interaction and cohesion, with increased traffic safety due to narrower streets and slower traffic (traffic calming).
The dense, centralised urban form of rapidly developing and motorizing cities is generally well suited to public transport systems. Traditional, high density cities are associated with more mixed land use thereby making these environments more conductive to non-motorised movement. Many Indian cities have strong corridors of development where densities and mixed land use are highest and that these are ideal for public transport, despite the fact that most such settlements do not have dedicated public transport right-of-way (ROW) and the high quality public transport services needed to support them. The mismatch between urban form and transport infrastructure support is a root cause of the chaotic transport patterns.
Railway Proposals
FAR 400 @ NDRS
Alternative
200@NDRS-OD-Pragati Maidan Rly.
Corridor, Palam-Dwarka Rly. Corridor,
Narela, Tikri Kalan, Anand Vihar
Land Use-Commercial, Res., Hotels, etc. Mixed Use, IPT, Warehousing, Business
hub, Green Corridor on Rly. Lines
Building Development Corridor Development with Air Rights ,
Rather than redevelopment of Railway Station, larger railway corridor should be taken up for its integration with surrounding land use, Public transit system and last mile connectivity. Part of the property development can finance the project, along with part of area to provide non-remunerative greens and public facilities
An example of integrated corridor development is the proposal of redevelopment of New Delhi Railway Station for Commonwealth Games held in New Delhi in 2010. The Railways proposed the redevelopment of Railway Station at an FAR of 400 so as to meet the expenditure involved by property development. It was suggested that they should take up redevelopment of larger rail corridor, including railway stations in the outer areas whereby they can take up four times property development and also provide space for facilities and green to the city, adjacent to railway lines. Rather than redevelopment of individual buildings, larger corridor should be taken up for its integration with surrounding land use, public transit system and last mile connectivity. Such projects can be self-financing, while part of area can be reserved for greens and public facilities.
Corridor based redevelopment can help to build more compact, dense, mixed land use, walk able and transit-oriented communities. These help in revitalising community life and attract the pedestrians back on the street. Complementary to it is the need for traffic calming by reducing speeds, noise and volumes by various measures such as no horn zoning, traffic circles at intersections, raised crosswalks, and partial street closures to discourage, short-cut traffic through residential neighbourhoods. Traffic calming may be necessary on certain streets, such as high security zones, areas fronting university, college, schools, hospitals, etc.
Traffic Calmings/Noise Control Measures
• Notifying No Horn Zones
• Constitution of Areawise Noise Control
Circles
• Preparation of Noise Monitoring and
Control Plan (NMCP)
• Hybrid Electric Vehicles
• Landscape
• Buffer Walls
• Rubberised Roads
Indian drivers are so fond of blowing horns that amused the architect- Patrick Crooke to Sketch the above Cartoon Design Standards to Improve Accessibility Providing convenient connections is a key to inclusive access. Connectivity can be increased during roadway and pathway planning, by adopting street connectivity standards, by providing pedestrian connection, by using shorter streets and smaller blocks, and by applying traffic calming. Typical street connectivity standards or goals include the features listed below, which must be flexible to accommodate specific conditions:
- Limit maximum intersection spacing for local streets to be 200 m.
- Limit maximum intersection spacing for arterial streets to about 300 m.
- Limit maximum spacing between pedestrian/bicycle connections to about 100 m.
- Provide street pavement widths - 6 to 12 m.
- Limit maximum block size to 5 Ha.
- Limit or discourage cul-de-sacs.
- Limit or discourage gated communities and other restricted access roads.
- Provide multiple access connections 8for pedestrians and cycling.
Design of Junctions/Crossings
- Avoid right hand turning traffic by provision of U-turns and round about. Provide left hand turn with safe passage for pedestrians
- A raised pedestrian speed breaker, provided at the termination of all roads into the junction, ensures pedestrian and cyclist’s safety and slow vehicular speed at the junction. The junction may be raised to match the level of the speed breaker to ensure slow traffic movement along the roundabout.
- At the junction side curves may be made to slope, assisting vehicles to negotiate the bends comfortably.
- For arterial road a pedestrian island (median) and a divided channeliser ensure pedestrian safety in the middle of the road. Street lights to be provided at the junction, the median and the footpaths to ensure a well it junction, roads and walkways.
- All housing and mixed use developments should be within easy walking distance of good public transport services that give access to the main centres of urban activity. A common standard of railway/metro bus access is 500 m. Beyond that distance, the proportion of people willing to walk declines progressively and car dependence increases. The 500 m criterion needs to be applied with care. It is the distance people on average actually walk if routes are indirect the straight-line distance may be much less. Access is also influenced by gradients (especially for older people) and psychological barriers such as Foot Over bridges (FOB), subways or intimidation by road traffic. Foot-over Bridges (FOB) and subways are hardly used as they cause inconvenience and insecurity to the users. As a result, the pedestrians risk their lives crossing the high intensity, high speed roads. It is necessary to provide wide and safer pedestrians corridors at grade while the motorised vehicles move up and down. The walkways also need to cater to wheelchair users that require avoidance of steps and provision of curb ramps. This may be possible by raising the carriageways of the road by about 2 to 3 meters, so that pedestrians keep moving freely at the ground level without mingling with vehicular traffic. Such facility should be provided on all major roads, national and state highways, in front of village abadi, transport nodes (Railway Stations, Metro Stations, Bus Terminals, etc.), and also forests and wildlife areas. The walking zone should be barrier free and designed as per the specifications. Public Transit System The objectives of public transport systems are:
- To deliver an effective transport network that is integrated, efficient, cost-effective and sustainable.
- To plan, develop and manage transport system to meet the needs, enabling growth; inclusion of the poor.
- To develop and implement policies to encourage commuters to choose the most appropriate mode of transport. The attributes of an efficient public transport system are the following:
- Public transport system should aim at reducing the growth rate of car travel, improving efficiency of public transport systems, reinventing the bus, mass rapid transit expansion and introduction of a new generation train and development of a metropolitan rail system.
- Road network and services linking existing and proposed growth centres to work centres, major industrial areas, airport, road and rail terminals, highways, and other corridors.
- Multi- modal passenger and freight systems, including improved integration and coordination.
- Integrated transport and land use planning interfacing employment and business areas and public transport.
- Environmental sustainability and demand management.
As such the determinants of an efficient Public Transit System are the following:
• High capacity
• High speed
• Low pollution
• Uses little urban space
• Cost effective
• Flexibility
• Safety and comfort
• State of the Art technology and fuel/energy efficiency
Car Traffic Pulled by Efficient, Comfortable and Safe
Public Transit
The basic idea is to establish an approach that integrates supply and demand side management and delivers an inclusive, safe and seamless mobility for all. This approach guarantees that all relevant aspects of transportation are considered, that synergises supply and demand side measures and long-term planning is facilitated. Various model options are available, which can be considered in combination or separately depending upon the context, traffic volume, sustainability (social, economic and environmental), costs and feasibility. Public transport is to be planned keeping in view the operational characteristics of different modes and their optimum efficiency/ridership.
• Buses: Regular bus systems in lower income cities typically do not exceed 30 km/h, and an average bus speed of only 18 km/h.
• Minibus : achieve average speeds of 17 km/h. However, minibuses offering limited stops average between 37 and 40 km/h.
• Trams and LRT: Trams are characterised by their very low speeds (average 15.5 km/h), typically due to the inner, denser areas where they operate and their lack of reserved rights-of-way. Manila’s LRT, with an average speed of 30 km/h, is an exception as it operates on a dedicated ROW.
• Metros: Metro systems are more common than trams and LRT with average speeds of operation at 32 km/h.
• Suburban rail: Suburban rail systems are clearly the best performing public transport modes which operates over longer distances with wider spaced stops. They achieve an average operating speed of 36 km/h.
• Ferries: Ferries are very slow modes and quite uncommon in cities. They average only 12 km/h or close to a typical bicycle speed in cities, and provide very direct critical links across cities where road bridges are not feasible.
• Speed-competitiveness of public transport: The overall average speed of public transport in only exceeds that of the private vehicles, where dedicated corridor are made available for those like BRT.
Source: Adapted from Kenworthy, 2011 Transport Modes and their Characteristics
Source: Kenworthy, J., 2011
Key Planning Principles for Efficient Public Transport
• Directness: provide direct routes between points of primary attraction - e.g. township centres
• Speed/reliability: use bus-only lanes, junction priority and other measures to ensure that public transport vehicles are not unduly delayed by other traffic.
• Linearity: shape neighbourhoods so that journeys are straight forward with little need for lateral trips, increasing linear demand and service quality.
• Density: grade densities so that the higher-density housing is close to steps, minimising the average walk distance.
• Clustering: locate along the route those activities that generate local trips, reinforcing visibility and potential for dual-purpose trips.
• Environment: ensure that the environment of the stops and main pedestrian access routes is pleasant and safe, avoiding physical or psychological barriers.
• Shelter/information: provide attractive bus/tram shelters with passenger information available.
• Access to stops and stations: All housing developments should be within easy walking distance of good public transport services that give access to the main centres of urban activity. A common standard for bus access is 400 to 600 m.
• Taming Private Cars: The key to a healthy transport strategy is taming vehicular traffic. The capacity of the road system should not normally be increased, because it simply encourages extra trips by car and compounds problems of air pollution and (sometimes) accidents, undermining the inclination to walk, cycle or use the bus. On the contrary, road capacity may be progressively reduced (allowing time for behavioural adjustment) as a direct consequence of positive planning for pedestrians, cyclists and public transport. At the same time, traffic speeds (the prime factor in accidents) should be held low by design, and parking policy used to deter unnecessary car trips.
• Road Networks: Hierarchical road networks are compatible with sustainability because they can help keep heavy traffic out of residential areas, and well-managed main roads with limited access reduce accidents. The secondary or distributor roads act as the natural focuses of activity within or between neighbourhoods, and should be traffic-calmed and integrated with local facilities clustered on them. The minor roads should not be a series of cul-de-sac but a network giving goods vehicles, bike and pedestrian permeability through the area, yet discouraging rat runs. The planners can significantly affect the viability of public transport by arranging roads, footpaths and land uses. The quality of bus and train services can be higher where the maximum number of people can reach their destination by the minimum number of routes. Linearity is therefore a key feature. The points where routes cross (nodes) then become the prime locations for local jobs and services and the focus for pedestrian and cycling routes. Public transport accessibility needs to be considered not as an after-thought, but as the starting-point for neighbourhood planning, with land uses attached to the public transport network.
Public Transit Stops are planned to have a catchment of 400 to 600 m to promote walkability and cycling/rickshaws as a feeder service to public transport system.
Source: Barton H.etal(2003) Shaping Neighbourhoods, Spon Press, London
Measures to Improve Public Transport Services Generally public transit is always under pressure to provide better and increased service, which is more comfortable, convenient and reliable. However, the additional routes, expanded coverage, increased services frequency, and longer hours of operation, need more resources, staff, facilities and subsidies. It may necessary to reallocate road space to public transit.
Dedicated bus lanes can double the efficiency, speed of the buses without need to invest in more buses. Comfort improvement include bus shelters, better seats, more convenient fare payment using electronic “smart card” and improved rider information and real-time information on transit vehicle arrival.
Principles of public transport planning
Source: Barton H.etal(2003) Shaping Neighbourhoods, Spon Press, London
ABC Zoning Policy of Amsterdam In Amsterdam, the change in transportation behaviour and travel pattern has been pursued through zoning regulations and land use control. The ABC land use code, in conjunction with transportation investments has resulted in business location decision. The ABC code classifies businesses according to their travel needs, as follows:
• A business that must be highly accessible to transit to succeed, e.g., commercial office space. This classification also states that private auto usage should be highly discouraged. Thus, the most parking spaces a business can have in this category is one private parking space per ten workers.
• a business that needs to be highly accessible to both private car and transit to succeed, e.g., a retail shopping centre. The most space for private parking is one per five workers.
• a business that needs to be accessible by private car or truck if it is to successful. There are no parking limits for a business in this category. The ABC code is designed to promote the land use that will support the public investment. It redirects the existing growth of the city and attempts to place it at transit stations, in major suburban office centres, and at urban villages. Each of these areas must have a significant rail option for commuters, shoppers, and residents. Non-structural and Non-Invasive Transport Planning It is being increasingly realized that the structural solutions, like flyovers built at enormous cost, provide only a temporary relief and fail to keep pace with the growth of traffic. The Master Plan for Delhi-2021, notified in February 2007, advocates a comprehensive strategy comprising preventive, structural and non-invasive transport solutions and approaches. For a synergy between land use and public transport system, it mandates restructuring the city by Transit Oriented Development. Higher density, FAR and mixed land use envisage a compact and smart growth. It mandates an integrated multi-modal public transit system, including Rapid Railway extending to NCR, together with corridor development. Simultaneously transport infrastructure, roads, dedicated two wheelers, cycle and pedestrian tracks are to be improved. As urban transport in Indian cities contribute up to two-third of the emission and pollution, it is crucial that the concepts of walk to work, inter-modal public transit, mixed land use, egovernance, transit oriented development and travel demand management are adopted, rather than just end of the pipe, pollution under check technology. Low carbon, green mobility is crucial for an efficient, sustainable and healthy society.
This needs moving beyond vehicle and fuel centric environmental controls, such as checking of ‘pollution, control certificate’. In most of the cities there is hardly a comprehensive and legally enforceable system to evaluate and obviate the impacts of urban growth and transportation infrastructure projects (like expressways, flyovers, etc.). Overemphasis upon transportation hardware such as more and wider roads, grade separators, fuels, engine efficiency and reduction of energy use, have marginalized the software of environmental sustainability of transport, such as promoting walkable city, mixed land use, higher density, compact and smart growth, which reduce the demand to travel. Popular solutions like widening of roads, construction of flyovers/grade separators and mega transport terminals are pursued by transport organizations and political leadership, who consider these as a matter of prestige and professional achievement. However, these often prove to be short term and sometimes even worsen the situation. Planning interventions and non-invasive, non-structural solutions such as promoting public transport and land use integrity need to be adopted.
A Case Study - Recovery of a River in Seoul (Korea)
Cheonggyecheon, a stream that marks the feng–shui origins of Seoul in 1392, used to run through central Seoul until the mid–1970s, it was originally a brook, and then developed into a stream with 14 waterways at the time of King Taejongin 1412 at the beginning of the Joseon Dynasty. The covering of the stream for military, sanitary and flood management purposes started early in the 20th century and was finally completed in 1958. The elevated Cheonggye expressway was opened in 1976. The Cheonggye expressway became one of the most important inner city highways with up to 168,000 vehicles a day, and the surrounding areas became the most important clothing clusters in the 1970s and 1980s. Removal of the expressway started on July 2003 and the rest of the stream restoration work was completed by October 2005. In total, the restoration took one year of urban planning processes and two years and three months of construction time. The successful implementation of the project paved the way of Lee Myungbak, then the mayor of Seoul, to become the president of South Korea in February 2008.
Elevated Expressway before demolition
Recovery of river by dismantling elevated expressway in Seoul, Korea Source: Erpenstein, Annette, 2012, Back in the Future: The Rebirth of Public Space in Seoul, Trialog,108, August 2012 Integrity between transport and urban planning, along with travel demand management, mode and technology choice are crucial factors in sustainability. Luxury air-conditioned buses have also been introduced for city transport in some Indian cities, which helped in changing the perceptions of public transport. Public transit reforms, such as reliability, frequency, inter-modal integration, single ticketing systems and the quality of public transport would be necessary interalia, keeping in view the elements of clean and non-carbon (green) fuels and traffic calming.
This way a reduction in use of fossil fuels and resulting pollution control is linked with public transport sustainability, efficiency and performance. Some cities in India (Indore, Ahmadabad, Delhi, etc.) have adopted environmental controls and protocols, performance standards and IT based traffic management and passenger information systems for public transport, which can be adapted more widely.
Bus Rapid Transit
The buses in Delhi carry an estimated 60 per cent of the motorized commuting trips, emit 4% of GHG, occupy 6 to 8% of road space and are only about one per cent (70,000) of the total motorized vehicles (75,00,000). Cars and two-wheelers represent 90 per cent of the motorized vehicles, emit 90 per cent of GHG, carry only one-third of commuters and occupy two-thirds of road space. The private vehicles are also responsible for most of the accidents and the victims are mostly the pedestrians or cyclists, who hardly have any space on the roads. The idea of dedicated Bus Corridor (Bus Rapid Transit) could double their speed, efficiency and carrying capacity, without investing in more buses. The concept has been partly implemented in Delhi covering 5.8 kms from Ambedkar Nagar to Moolchand junction. This is disabled and wheelchair friendly with tactile flooring and low floor buses with footboard at level with the platform. The corridor has special street lighting for the safety and security of pedestrians. A dedicated bicycle lane has been built for the cyclists. The bus stops provide user information (fixed signs, maps, variable message signs), pedestrian crossings, integrated fare collection systems, protection systems and communication elements. Delhi Government plans to build 26 BRT corridors in Delhi, covering a total length of 310 km by 2020. However, the project has run into difficulties and received bad press due to squeezed right of way for private vehicles, and partly due to faulty selection of pilot route, area around which is inhabited largely by car owners, and does not have an escape route within three kilometers. As a result, the Government of Delhi has put on hold the further development of BRT Corridor in spite of positive feedback from the surveys.
Integrated Transit Corridor
The BRT system is also being implemented in some other cities of India under Jawaharlal Nehru National Urban Renewal Mission (JNNURM) in Indore, Jaipur, Ahmedabad, Rajkot, Bhopal, Surat and Visakhapatnam and Pune. Operational Characteristics of Different Public Transport Mode Public transit facility cannot be planned in isolation, but needs to be complimented by various strategies as given below:
• Integrate land use and transport planning by forming a unified transport authority through the merger of various entities, such as, state transport department, public transit corporations, public works department, etc.
• Develop a comprehensive and efficient road network along with sidewalks.
• Improve public transport through multi-modal transit projects, commuter and traffic facilities.
• Manage the demand for road space through vehicle ownership and usage measures, such as, electronic road pricing schemes, vehicle registration and licensing, differentiated vehicle taxation, vehicle entry permits and toll payments. The economic instruments play a central role in demand side management, which include Electronic Road Pricing (ERP),
Vehicle Quota System (VQS), Vehicle Entry Permits and Tolls.
Land Use and Public Transport Planning in Curitiba Curitiba had been able to successfully integrate land use and transport planning. Land development in Curitiba has been guided along five linear axes from the city centre, each axis being served by dedicated bus lanes. These radial routes, built in the 1970s as part of an urban development package aimed at regulating the growth of the city, has in each route three separate roads running in parallel. The middle one has an exclusive two-lane bus ways flanked on either side by a single direction service road. The two outer roads are single direction multilane roads. High capacity buses operate on bus way trunk lines linking downtown terminals to upstream feeding stations. They operate in a hierarchical system of interconnected services, from express to inter-district to feeding stations. They are also aided by priority status at signalised intersections. Other features of the bus system include automatic fare collection and extensive use of articulated buses. Curitiba’s land use plan emphasizes control on both the type and density of land use. Higher building density ratios are allowed along the designated public transport axis rather than in areas remote from public transport. In other words, the density of development has been controlled so that transport demand is limited to the capacity of the public transport system. These controls encourage matched development of commercial and high density residential buildings in areas outside the city centre with consequent restraint on trips generated between the outer and inner urban areas.
Informal Transport
A cultural predisposition among motoring class and transportation officials to expedite automobile flows, fail to appreciate the importance of informal transport. The pressures from customers and industry seeking to sell the automobile and a mind-set among public officials that informal transport vehicle are inferior, obsolete, and suited only for backward cities or rural areas add to the marginalisation of informal transport. In Indian cities, there is largely an absence of any kind of normative policy framework for informal transport services.
Informal and intermediate modes of transport, i.e. 3 wheelers, vans, pickups, manual thelas and rehri, etc. cater to about 60% of goods movement in the cities like Delhi. As compared to small truck, the autos and rickshaws are substantially cheaper, which by multiple trips deliver as much as a 5-ton truck in a day. Courier services, perishables, such as milk, vegetables, fruits, groceries and other short-haul deliveries are increasingly being made by auto-rickshaw, van or tricycle,These reach in the narrow lanes and congested areas where public authorities do not allow trucks/public carriers during day time and also during frequent VVIP visits, processions, ceremonies, etc.
However, the intermediate and informal transport sector is riddled with numerous challenges, including lack of parking space and road right of way, harassment by traffic and transport officials, poor vehicle safety and fitness standards, lack of insurance, etc. Although competitive and affordable, low fares force the operator using substandard fuels, polluting engines and preclude service improvements.The predisposition among motoring class and transportation officials is to expedite automobile flows, and they usually fail to appreciate the importance of informal transport. This mindset together with the pressures from customers and automobile industry add to the marginalization of informal transport. There is absence of any kind of normative policy framework for informal motorized transport services, which is a part of overall city transport. Delhi had about 60,000 transport related shops and repair facility, of which onethird are illegal or informal. Keeping in view the service rendered by informal transport and workshops, there is a need to integrate them with land reservations.
There is ample scope and need to develop and plan for NMTs and intermediate public transport (IPT) to improve their safety, efficiency, speed, and comfort. By adopting standards, protocols and legal provisions, together with simple technical innovations, such as, installing a two-speed gear system would enable the rickshaw-puller to pedal easily. Redesigning the handlebars in such a way that the rickshaw-puller does not have to strain his wrist and lungs, its efficiency can be substantially improved. The puncture proof or tubeless tyres, using lighter and more durable, sturdier metal, a better designed seat can provide a more comfortable ride to the commuter. To meet the requirements of school children a motor with a battery to run for small distances and a multi-speed gear system can be fixed for smooth and easy pulling. To rectify the imbalances, which often cause overturns in the conventional rickshaw, the geometry of the design can be improved, together with other aspects of safety. In Agra, state of the art designer rickshaws have made them prestigious for the users, besides being more efficient, less polluting and more comfortable.
Dedicated Right of Way for Pedestrians, Cyclists, Buses Bicycle and Pedestrian Planning
1. Increase the proportion of public roads, and take up traffic calming with dedicated corridors for pedestrians and cyclists. The length of dedicated cycleway can be gradually increased by planned target each year. Likewise the length of pedestrian-friendly streets can be targeted each year.
2. Provide incentives to increase the proportion of institutions, businesses and dwellings with facilities for bicycles (e.g., daytime storage).
3. Increase on a priority-route basis the proportion of public transit vehicles capable of carrying bicycles.
4. Develop an active campaign to publicise the personal, community and ecosystems health benefits of cycling and walking.
5. Create and publicise targets to increase the annual share of work and shopping trips taken by bicycle or by walking.
6. Provide end of trip facilities , like bike racks, storage lockers and shower changing facilities at railway/metro/bus station, offices, shopping centres, etc.
Source: Adapted from Kenworthy and Laube (1999) LOS for PedestriansA Pedestrian Passage
Intelligent Traffic Management Systems
Intelligent Traffic Management Systems, traffic simulation, single ticketing, e- governance are important features of seamless public transport. Variable digital signage provides advance information about traffic jams, accidents, etc. The e-governance is an effective to conserve transport and reduce the need to travel. It is proposed to adopt ICT tools for zero defect roads, services and their maintenance. Subterranean space can be explored for roads, metro, parking, etc. There is a need to improve the drainage, mandatory use of porous paving and swales for rainwater harvesting on all foot paths and parking areas.
Traffic Simulation
• Infeasibility/inadequacy of mathematical treatment of traffic process
• Doubt on accuracy of mathematical models and heuristic approach
• Difficulty in modeling traffic dynamics and traffic control systems
• To answer “what if” questions
• To assist the system designer to find solutions
• Address traffic problems - Congestion and Environment
Intelligent Traffic Control Systems
Source: Planning Commission, 2013, Twelfth Five Year Plan
Urban Road Safety
With an exponential growth of vehicular traffic, India has a notorious distinction of highest road deaths and accidents, causing more than 1.40 lakh deaths and 10 lakh fatal accidents per year. The largest number of victims is the pedestrians, who are invariably forced to walk amidst vehicular traffic or on the narrow footpaths, which are often encroached. They are expected to use the pedestrian underpasses or foot-over bridge to cross the high volume traffic roads, which adds to their difficulties. With the increasing signal free roads and flyovers, the frequency of accidents involving the pedestrians has increased.
It is necessary to provide wide and safer pedestrians corridors at grade while the motorised vehicles move up and down. The walkways also need to cater to wheelchair users that require avoidance of steps and provision of curb ramps. Such facility should be provided on all major roads, national and state highways, in front of village abadi, cattle grazing fields, transport nodes (Railway Stations, Metro Stations, Bus Terminals, etc.), and also forests and wildlife areas.
A 10 to 15 m wide pedestrian underpass is created by raising the vehicular carriageway by 2 to 2.4 m and dipping the pedestrian passage by 0.5 to 1.0 m. It shall be provided at regular intervals on all NH, SH, Arterial roads where there is sizable volume of pedestrians, NMTs/cycles, cattle/wildlife. Similar provision is required on the railway lines for safe passage of pedestrians and animals. Safe corridors for cyclists, cattle, pedestrians and wheelchair users Corridor plans and strategy for safe mobility should cover the following:
• Reduce need to travel by Transit Oriented Development and Travel Demand Management
• Improvement of public transport, sidewalks , cycle tracks, NMVs underpasses and overpasses
• Safety oriented planning and engineering specifications, norms and practice
• Upgrading of traffic control - multi-functional and sophisticated signal control and ITS
• Driving license regime
• Work Zone Safety
Planning for pedestrian zone and road safety
i). Identifying accident prone points, pedestrian movement, volumes and areas
ii). Prepare area wise/corridor wise pedestrian and road safety plans with dedicated footpaths, NMTs and cycle lanes
iii). Underpasses at grade for pedestrians and cattle at regular intervals
Engineering and implementation
i). Road management plan, repair, drainage and work zone management
ii). Speed breakers
iii). Maintenance to aim zero defect roads
iv). Road markings, zebra lines
v). Provide railings and crash barriers, signage, orientation points and guide maps
Traffic regulation/control and audit
i). ITS, Intelligent signals, alarm and communication system, unified CCTV command platform be installed
ii). Streamline drivers licensing procedures, training and behavior
iii). Check overloading of goods vehicles and joy rides
iv). No free U turn, No blind corners, keep right of way and crossings free from parking, bus stops, kiosks, taxi stands, encroachments, etc.
v). Online complaints and redressal system to be in place
vi). Inter-state/city and inter-departmental coordination,
Help in emergency
i). Helpline, surveillance, first aid, trauma centres, ambulance service
ii). Integrated/common complaint centre
Institutional capacity building, public participation and support
i). Organisational resources, financial strengthening and capacity building
ii) Promote active safety campaigns by participation of public, road users/citizens
iii). Accountability, monitoring framework
iv). Revisiting Motor Vehicle Acts and other legal framework
v). Pedestrians right to safe mobility be deemed as a human right
Bb
HHEn
L Human
Environment & Energy
Norms /Engineering
HR/Skills/ITS
Legal /Enforcement
Public Transport/NMTs
TOD/TDM/W2W
Planning and Design
Simulation /Behaviour
Integration/ coordination
Zero Risk/Danger
Reactive
Incremental
Radical
Transformative
Regulatory Strategy Governance Performance
Transport and Road Safety Ladder
Eco-Mobility
Keeping in view the importance of road safety, it needs to take up as a mission, with a well structured action plan. It should move beyond reactive actions to the incremental radical and transformative. These include regulatory, strategic, governance and performance aspect of road safety ladder. The ‘National Road Safety Mission’ should be under the PM and ‘State Road Safety Missions’ should be under the CMs of each State.
References
1. Anon undated, Land Transport, Singapore Fact Sheet Series, Ministry of Information, Communications and the Arts, Government of Singapore,
2. Barton H.etal(2003) Shaping Neighbourhoods, Spon Press, London
3. Boesiger, W (Ed.) (1999) Le Corbusier-Complete Works, Birkhauser Publishers, Besel
4. Central Pollution Control Board,Various reports (2005-10), New Delhi.
5. Delhi Development Authority (2007), Master Plan for Delhi-2021, New Delhi.
6. Dimitriou, H.T. (2011) ‘Transport and City Development: Understanding the Fundamentals’ in Urban Transport in the Developing World: Perspectives from the First Decade of the New Millennium edited by Harry t. Dimitriou and Ralph Gakenheimer, Edward Elgar, Cheltenham
7. Dotson, E. (2011) ‘Institutional and Political Support for Urban Transport’ in Urban Transport in the Developing World: Perspectives from the First Decade of the New Millennium edited by Harry t. Dimitriou and Ralph Gakenheimer, Edward Elgar, Cheltenham
8. Doxiadis, C. (1965), ‘Islamabad, the Creation of a New Capital’, Town Planning Review, 36(1), pp.1-
9. Egli, E., (1967) Geschichte des Stadtebaues Erlenbach-Zurich Eugen Rentsch Verlag
10. Frampton, Kenneth (1996), Charles Correa, Perennial Press, Mumbai
11. Gakenheimer, R. (2011) ‘Land Use and Transportation in Rapidly Motorizing Cities: Contexts of controversy’ in Urban Transport in the Developing World: Perspectives from the First Decade of the New Millennium edited by Harry T. Dimitriou and Ralph Gakenheimer, Edward Elgar, Cheltenham
12. Goodall, Christ, (2007), How to Live Carbon Life, Earthscan, London
13. Government of India, (2013), 12th Five Year Plan, , Planning Commission, New Delhi
14. Government of India, (2006), National Urban Transport Policy, Ministry of Urban Development, New Delhi
15. Intergovernmental Panel on Climate Change (2007) Climate Change 2007: Synthesis Report.Contributors of Working Groups I, II, and III to Fourth Assessment Report of the IPCC, IPCC, Geneva
16. Jain A.K., (2009), Urban Transport, Planning and Management, APH Publishing, New Delhi
17. Jain A.K., (2012), Sustainable Urban Transport and Systems, Khanna Publishers, New Delhi
18. Kenworthy and F.B. Laube (1999) An International Sourcebook of Automobile Dependence in Cities, 1960-1990, University Press of Colorado, Boulder
19. Kenworthy, J. (2011) ‘An International Comparative Perspective on Fast Rising Motorization and Automobile Dependence’ in Urban Transport in the Developing World: Perspectives from the First Decade of the New Millennium edited by Harry t. Dimitriou and Ralph Gakenheimer, Edward Elgar, Cheltenham
20. Ling, (1967) A Runcorn New Town Master Plan, Runcorn Development Corporation,
21. Lefèvre, (2009), citing Newman and Kenworthy, 1999.
22. M.,Rahamatullah, (2010), Strengthening physical Connectivity in South Asia, International Conference on SAARC @ 25 Organised by IIC & RIS, 16-17 September 2010, New Delhi 23. National Capital Region Planning Board (NCRPB-2005) – Regional Plan for the NCR-2021, New Delhi.
24. Newman, Peter, R Kenworthy, (1999), Sustainability and Cities: Overcoming Automobile Independence, the Centre for Resource Economics, Washington DC, USA.
25. Rees, William E., (1997) Ecological Footprints and Urban Transportation, Velocity, Barcelona.
26. Replogle, M. (1993), Bicycle and cycle rickshaws in Asian cities, 6th conference on urban transport in developing countries, CODATU-VI, Tunis, 1993.
27. Schäfer, A. (2010) ‘The Future of Energy for Urban Transport’ in Urban Transport in the Developing World: Perspectives from the First Decade of the New Millennium edited by Harry t. Dimitriou and Ralph Gakenheimer, Edward Elgar, Cheltenham
28. UN Habitat , (2009), Global Report on Human Settlements; Planning Sustainable Cities, Earthscan, London
29. UN Habitat, (2013), Planning and Design of Sustainable Urban Mobility, Nairobi/New York
30. Vuchie, R.V. (1981), Urban Public Transport System and Technology, Prentice Hall, Eaglewood Cliffs, New Jersey
31. WHO, (2009) Global Report on Road Safety Washington
32. World Health Organisation, (2004), World Report on Road Traffic Injury Prevention, Geneva
33. Wilbur Smith Associates, (2008) Traffic and Transport Policies and Strategies in Urban Areas in India, Ministry of Urban Development, New Delhi
34. World Bank, (2002), India’s Transport Sector, the Challenges Ahead, Washington, D.C.