Ultrasonic Test Methods for Concrete
Manu Santhanam
Associate Professor, Civil Engineering, IIT Madras
INTRODUCTION
|
A number of investigative techniques are available to study the condition of concrete in a structure. These include the evaluation of the material in a non-destructive manner, i.e. without causing any damage while testing, and semi-destructive tests such as removal of a piece of the material for evaluation, or even destructive tests where the material is tested to failure without damaging the overall structure.
The non-destructive techniques range in sophistication from simple ones where the quality of sound obtained by striking the surface of the material with a hammer indicates the quality of the material, to complicated techniques where the ultrasonic signals travelling through the material are analyzed mathematically.
|
 |
Stress wave propagation methods are composed of a number of techniques that constitute the most reliable methods for qualification of damage in concrete structures. These methods involve the propagation of sound waves through concrete; the stress waves are created either by pulses generated using ultrasonic transducers, or by impact.
PROPERTIES OF SOUND WAVES
Three main types of sound waves travel through materials (these are classified depending on the direction of motion of particles)
-
Compressional / longitudinal wave (P-wave; P for primary)
-
Shear / transverse wave (S-wave; S for shear)
-
Surface wave (R-wave; R for Rayleigh)
In a compressional wave, the particles of the material vibrate in a direction parallel to the wave propagation. In a shear wave, the particles vibrate perpendicular to the wave direction. In the case of surface waves, the particle vibration has both parallel and perpendicular components.
Other types of waves also travel through materials. Lamb waves are planar waves traveling through thin sheets, while standing waves are created by the interference of two or more waves.
The wave velocities for the main waves are dependent on the stiffness and density of the material. The velocity of compressional waves, Vc α (E/ρ)0.5, while the velocity of the shear waves, Vs α (G/ρ)0.5, where E is Young’s modulus of elasticity, and G is shear modulus or modulus of rigidity. Vs is 0.5 - 0.6 times Vc, while the velocity of surface waves Vr is 90% of Vs.
When sound waves travel from one medium to another, a part of the energy gets reflected and the other part gets transmitted. The amount of reflection and transmittance depends on the acoustic impedance of the media.
Acoustic impedance, Z = ρV, where ρ is the density of the material, and V is the wave velocity. Z values for some typical materials are shown in Table 1. If the acoustic impedances of the media are known, then:
% transmitted energy Et = 4Z1Z2/(Z1+ Z2)2, and
% reflected energy Er = (Z1-Z2)2/(Z1+Z2)2.
The above formulae are valid for normal incidence of the sound wave. When the incidence is at an oblique angle, reflection and transmittance occurs in a manner similar to that for light rays.
Table 1. Acoustic impedance for some materials
| Material |
Z (kg/m2s) |
| Air |
0.40 |
| Water |
1,500,000 |
| Concrete |
9,000,000 |
| Steel |
47,000,000 |
SOUNDING AND CHAIN DRAGSOUNDING AND CHAIN DRAG
A qualitative evaluation of concrete can be easily obtained by just sounding it (i.e. tapping it) with a hammer. When the hammer is struck on good concrete, a ringing sound is created. However, on areas where delaminations or cracks occur, the striking of the hammer produces a drum-like sound. The limitation of this method is that it cannot detect defects that exist deep in the member. Also, defects lying under overlays are also difficult to find.
In the case of steel members, the joints can be tested using a hammer. Tapping with a hammer can give information on the tightness of the rivets and bolts, and also whether there is any movement. Excessive movement in a connection allows for repeated impact loading which will eventually cause fatigue damage.
Chain drag is another way of finding out delaminated parts and voids. Compared to sounding with a hammer, chain drag can cover more area in a given time. In this method, the operator passes a heavy chain on the surface of the concrete. The quality of sound generated is picked up using microphones and characterized.
Figure 1 shows a schematic diagram of the use of sounding and chain drag methods. The areas identified as 'defective' in the sounding technique could be marked using paint for further investigation. Chain drag is a more effective method as it covers a large area, and has the potential to be mechanized. For example, to evaluate a concrete bridge deck, a simple arrangement would be to attach chains at the back of a vehicle, and keep appropriate sound sensors (microphones) to record the sound as the vehicle makes a slow pass over the deck. With suitable data logging, this can result in complete evaluation of the bridge deck.
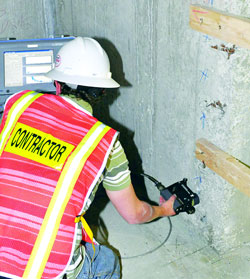
ULTRASONIC PULSE VELOCITY (UPV)
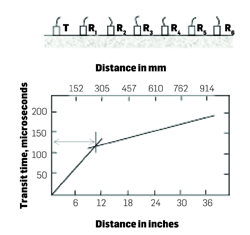
In the UPV method, the velocity of a pulse travelling through concrete is measured and correlated to its stiffness. The velocity of the pulse increases with the stiffness of the concrete, but decreases with increasing density. Wave attenuation increases when concrete becomes denser, because of absorption of energy. Typical set up of the UPV test is shown in Figure 2. As shown in the figure, the test can be used in three modes - direct, semi-direct, and indirect. The direct mode, or the through-transmission mode, is the most reliable, but needs access to both sides of the material. In the indirect mode, a plot is drawn between the travel time of the pulse and the distance between the transmitter and receiver, as shown in Figure 3. The distance at which the slope of the plot changes represents a change in the material property (which could be a transition from bad to good concrete, or the other way round).
Figure 3. Use of UPV in the indirect mode
|
The transmitter and receiver are both piezoelectric transducers. Piezoelectric materials are able to convert mechanical impulses to electrical signals and vice versa. The receiver picks up the pulse generated by the transmitter (since the compressional wave is the fastest, it arrives at the receiver first). If the distance of travel is known, then the velocity can be calculated by a measurement of the time from the waveform. The modulus of elasticity can then be calculated from the expression:
|
 |
V = (E/ρ)0.5, where ρ is the density of the material.
This expression is valid when the wavelength of the pulse is larger than the specimen width. However, when the specimen width is greater than the wavelength, then this expression should be modified to:
V = k(E/ρ)0.5, where k is a function of the Poisson's ratio of the material.
Some typical UPV scenarios are shown in Figure 4. When the concrete is of uniformly good quality, the pulse is able to travel through without any disturbance. When there is reinforcing steel in the vicinity, the pulse will travel faster as it goes through the steel. When the pulse has to travel through a region full of voids and microcracks, the time of travel is increased. Because of the presence of cracks, the pulse may not have a direct path, and has to go around the tip of the crack. Thus, the travel time is further increased. Sometimes due to a large crack the pulse can get completely reflected back to the transmitter and no signal is received (From acoustic impedance data, it can be seen that a pulse travelling from concrete into air, which in this case is the crack, would get completely reflected).
Figure 4. Some scenarios of using UPV to detect cracking in concrete
IS 13311 - Part I (1996) gives a guideline for the analysis of velocity measurements. This guideline is presented in Table 2.
Table 2. Velocity criterion for concrete quality grading as per IS 13311 – Part I (1996)
| Sl. No. |
Pulse velocity obtained in direct transmission mode (km/sec) |
Condition of concrete |
| 1 |
> 4.5 |
Excellent |
| 2 |
3.5 – 4.5 |
Good |
| 3 |
3.0 – 3.5 |
Medium |
| 4 |
< 3.0 |
Doubtful* |
* Either quality is poor or more tests necessary
In order to get reliable data from UPV, it is thus essential to obtain access to both sides of the structure. Adequate training and calibration is necessary to use the semi-direct and the indirect arrangements. It is difficult to point out the exact location of defects in UPV tests, although an overall assessment of the quality of concrete can be obtained.
IMPACT ECHO / PULSE ECHO METHOD
In the impact echo method, and impacting device such as a hammer is struck on the concrete surface. The sound waves that reflect off defects or other features are picked up by a receiving transducer, and conveyed to a signal processor. The waveform is analyzed at the signal processor. From this analysis, the amplitude and travel time of the waves can be evaluated. A schematic description of this system is shown in Figure 5. Also shown in the same figure is a schematic of the pulse-echo system. In this system, the pulses are generated by a pulsing transducer. The same transducer can then act as a receiver, or an alternate receiver may be provided. The signal is again relayed to a signal processor.
Figure 5. Schematic diagram of the impact-echo and pulse-echo techniques
Figure 6 depicts the measurement of defects using these systems. The travel time of the pulse can indicate the depth of the defect, if the overall depth of the member and the corresponding travel time are known. In addition to such simple analysis, the signal received by the waveform analyzer can be analyzed. The main bang (MB) is what is perceived immediately on impact. The back echo (BE) is the signal that is reflected from the back wall, while the flaw echo (FE) is the signal from the crack or flaw. The time of arrival of the pulse can be analyzed to obtain the depth of the flaw relative to the overall depth. In the example shown in Figure 6, in case (1), the wave is reflected off the back wall. In case (2), a part of the wave is reflected off the tip of a crack, and the other from the back wall. In case (3), the wave is completely reflected off a large crack, and does not propagate on to the back wall, while in case (4), the wave is reflected off a lesser depth of the wall.
Figure 6. Schematic depicting the use of pulse-echo technique
Reflections from corners and edges, as well as from reinforcement should be accounted for in the analysis. Frequency domain analysis is sometimes performed in order to account for multiple reflections between the surface and interface (flaw or back wall). A fast Fourier transform (FFT) is used to convert time domain pulses into frequency domain data. The discussion of frequency domain analysis is beyond the scope of this course.
Since the exact location of defects can be pinpointed using the impact- and pulse-echo techniques, a comprehensive 3-D mapping of defects is possible by doing area scans, as shown in Figure 7. In this figure, both linear scan and area scan are shown. In the area scan, the different shades represent different reflection times.
Figure 7. Scanning with the pulse-echo technique
Some limitations of this technique are that defects lying under other defects are not easy to detect. Also, reflections from sides, edges, and corners can confuse the data. A sufficient difference in acoustic impedance between the two media is necessary to obtain good information.
SUMMARY
Ultrasonic methods help in analyzing the quality of concrete, and, sometimes, the location and extent of defects. It must be clearly understood, however, that high attenuation of sound waves can occur due to the presence of air voids in concrete; hence, deep defects are not easy to find. Furthermore, only low frequencies and therefore, resolution is compromised. Interference in results from the aggregates and reinforcement is common, in other words, heterogeneity of concrete is a problem.